When processes such as making, packing, cleaning, sanitization, customization, pasteurization, sterilization, assembly, etc. are properly validated, the team responsible can demonstrate with data that the variability of the process involved is under control and minimized.
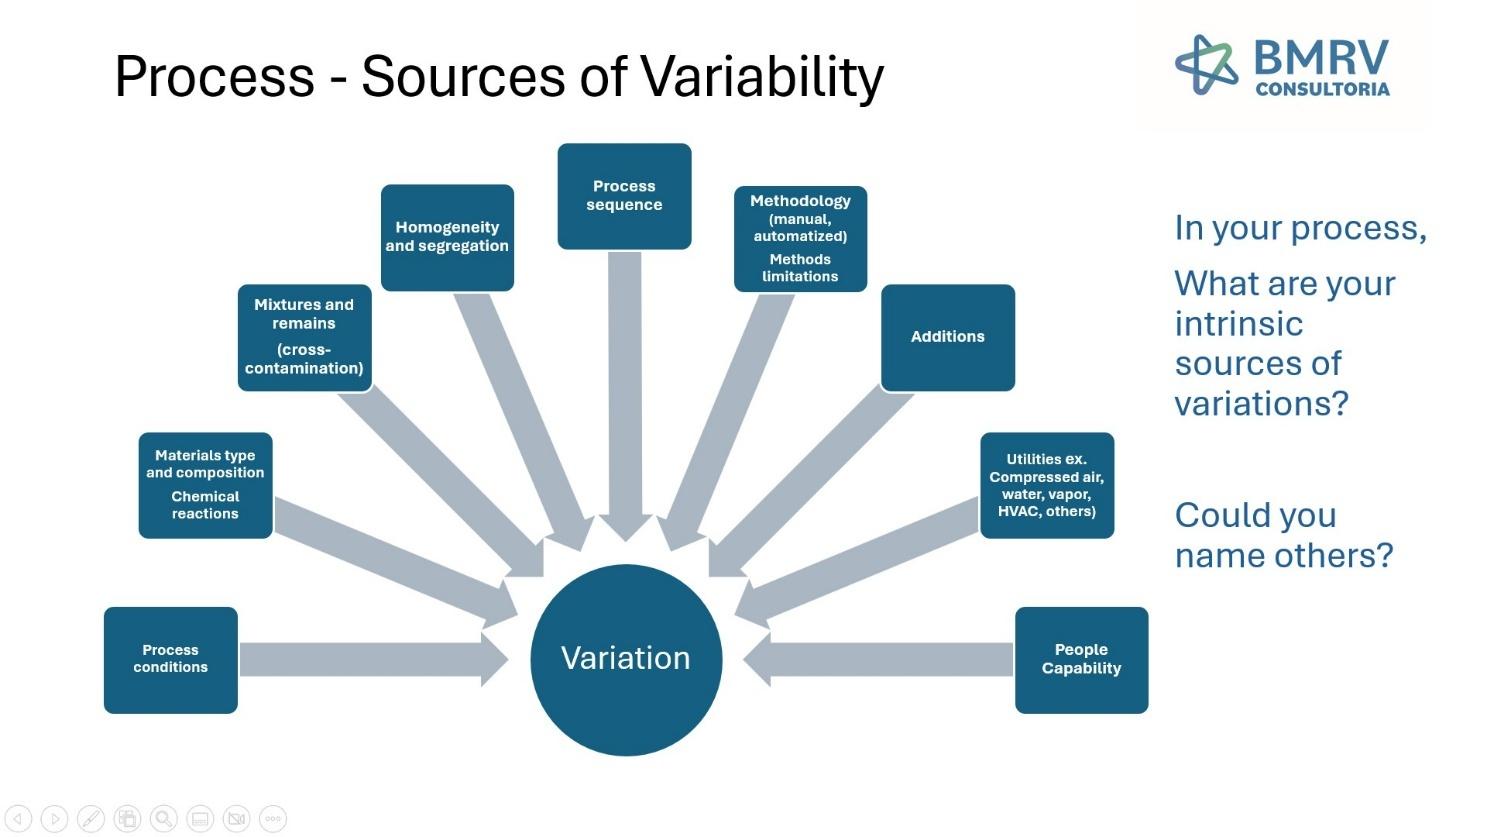
The only way to demonstrate that is to map the sources of variability across the whole supply chain for the process involved, map in detail the process to understand risks, key parameters, limitations of the parameter that are being monitored, methodologies and limitations, what is being done manually, and what is being done following automation technologies. Many strategies are available for those purposes. What is important is to understand assumptions made and verify data and be aware of what can change versus time or due to regular operation activities such as maintenance, repairs, changes, and people capability, among others.
The practice of identifying key control parameters (primary and secondary), how they vary, and determining alert and action levels is imperative to warrant good process control. Regardless of the nature of the parameter involved, the characteristics of the process, the source of variabilities, the sampling plan, etc., the analysis should be clearly supported by a sound scientific rationale verifiable versus time.
When many of the quality teams failed? Just to name a few
- Validating the process focusing on regulatory requirements only, without understanding system specific features imposing risks that were not taken into consideration.
- Validating but not conducting scientifically sound verification process on regular basis to demonstrate validated state is still in place.
- Assuming that the new equipment being used for the first time will remain the same after 2-3 years of continuous operation.
- Poor change management when new formulations being processed in the actual system/equipment are assumed will behave the same as the previous formulations. People assessing the change are not properly trained.
- A new product developed with ingredients that might precipitate inside the equipment and the team assumed that will require the same cleaning approach used for the previous product because passed the pilot test and no proper verification was made versus time.
- Not understanding or not time to think about the limitations of the pilot testing.
- No knowledge about biofilms formation and dynamics.
- No knowledge about product preservation and sanitization differences.
Key definitions
Process – set of related activities (operations and sub-processes) that use inputs (requirements) to produce outputs (results, products). Everything can be described as a process.
Homogeneous system is the one that is the same regardless where or when you see it. It has the same quality state all over the places. Even if composed by several parts, those are interacting and structured in a way that no individual part is able to be distingueshed (example, aqueus solutions, rain water, steel). Diluted dyes use to form homegeneus dilutions at the right concentration level.
Heterogeneus system is the one where you can distinguishe parts, layers, phases, precipitates, compounds (ex. water with ice; soil; corrosion in piping; contaminants in powders). Imagine sampling powdered materials in one ton supersacs. How to take representative amount of samples assuring you are not introducing contaminants during the sampling? Of course there are ways and tools for that . However, there is the risk of not having enough samples and the cross-contamination risk. How to balance that?
Measure – is the act to estimate or assess the extent, quality, value, or effect of something. When we monitor a system or a process we take measures of the different parameters that need to be controlled to demonstrate the process is behaving as expected.
Specifications – is a detail description of how something should be or should be made to achieve the right quality level as per customer and regulatory requirements. It is a set of documented requirements by a material, design, product, or service.
Control Limits – control limits are the guardrials that delineate the acceptable range of variation within a process (Lean Six Sigma definition). Those limits are estimated using statistical analysis. Your process should have the capability to operate with control limits far enough the specification limits to assure control and timely action when something deviate from what is expected. Control limits are determine by what your equipment and system can achieve not by the specifications.
Sampling – is the process of selecting a group of individual data points from a larger set with the objetive to represent the whole. It is a fundamental technique because that allow to study a big populations based on results from a fraction of it. The validity of the sampling will depend on the purpose of the research, the source of variations, and the statistical approach used to establish the sampling astrategy.
Process Capability – is a statistical measurement that determines if a process is producing results at the expected limits. It is a measure of the process control. It measure the variability of a determined process output as per intrinsic variability tolerance for specific parameters chosen for that purpose. It assume that the data obtained from the parameters tested behave as a normal distribution.
The Normal Distribution
A Normal Distribution of data (Gaussian) is characterized for the simetry of the data along the populational mean (µ) which is the value with the highest probability (Y axis) where data values are shown in (axis X). The widest is the distribution the highest is the variation (Variance, σ) of the data. In a process considered controlled variance cover 99,74% (3σ) of the distribution. Widest distributions are considered without controlled (area below the curve lower than 99,74%), and processes with lowest variations are considered better controlled.
Not all the simetrical distributions are considered normal. For example, heavy tailed or light tailed distribution are also considered not normal jointly with the skewed distribution were the value of X with higest probability is not located in the middle of the distribution but in one of the sides.
You might have other kind of complex processes described by modeling using complex functions were a diverse number of parameters are changing simultaneously. However, in general for the type of decisions we need to make in quality management, the Teorem of the Central Limit which states that under certain conditions, if you have enough amount of data you will be able to analyze them under the conditions and precepts of a normal distribution. This facilitates our life a lot in terms of statistical approaches to use to treat our processes.
When we sample a population we take a portion of it, if we analyze the data we assume that the calculated mean of the sample (x̄ as per sample n) is very similar to the population mean (µ of size N = population size) and that the variance calculated of the sample (S) is similar to the populational variance (σ). That will be truth if we take enough amount of data (n= sample size) not biased and at random to assure it is really representative of the population being tested.
Commonly the data we obtained after sampling has an intrisic error around the mean, and that error can be calculated for any given sample size n, as SEM = ±S/√n. This value is very useful to determine control limits, and alert and action limits; to determine if different conditions being tested belongs or not to the same populations, among other uses. In Life Sciences variations are expected and knowing how to deal with it help is to manage the processes properly.
Dealing with control charts at operations, the approach is similar. What is being use are capability indexes (ex. CPK) that are based on the measures of the parameters variability under certain tolerance range around the established target allowing to predict if a process is in control.
Sampling approaches
So, the main way to assure we have enough information about the process we want to control is taking enough measurements of the relevant data describing our process.
There are two basic approaches for sampling:
- The classical ramdom sampling to determine probability of defects To name some: ANSI/ASQ; Military Standard 105 (MIL-STD-105); ISO 2959-1; ASTM E2234-09.
Mathematical approach for determining sample size. Methodology designed to accept or reject product or material batches. Not biased. Applicability very limited for those processes where the probability of defect is very low which require a very big number of samples to be tested to assure enough capability to detect the defect. Example, for esterile operations this approach become economical unviable because the probability to get a unit contaminated is 10-6 or less. Impossible to get the amont of samples required to check for esterility; and we are not even taking in account that the result will come many days later. So, another strategy is required to assure consumer safety and product quality.
- The risk-based approach. This approach focus in the source of risks and variability in the process involved. It is biased to risk. Increase sampling in those riskier sub-processes and points, monitor and assess equivalent parameters that allow to infer data (ex. temperature and time to assure sterility instead only focus on microbiological testing of finished product). Enable parametric release. Decisión making is based on risk. Enable testing different conditions and stages. It require a thorough knowledge of the process and the potential emerging risks. Limitation: New risks might become blind spots.
Surprisingly there are other sampling approaches commonly used and accepted by some regulatory boards which are not statistically supported.
n = √N + 1 (AOAC Sampling Policy created for agricultural purposes and broadly Applied across industry since 1927). “Rule-of-Thumb” guide. Mostly used to test materials.
If N is high (>30, better if >100 where N is the number of containers) the population can be approached as normally distributed and with this calculation the n obtained approximate to the 90% of the AQL statistical approach with a 95% confidence. However, for a small N (most of the cases) in manufacturing operations the behavior of the value n deviates from the normal distribution making the sample not representative. See Saranadasa, 2003.
TRS-929 – Annex 4. WHO Guidelines for sampling of pharmaceutical products and related materials. For N>4, if less all containers should be tested.
- Plan n: n= √N +1, for uniform materials and suppliers are well known and source trusted.
- Plan p: n= 0.4 √N, if material comes from trusted sources and identification is known.
- Plan r: n=1.5 √N, if material is suspicious and from unknown sources. The sample must pass the identification test.
B. 10% sampling. Recommended for populations >20 units. Some use 4% sampling, if 10% costly.
C. British Standard BS 5309 (1993), que usa a formula n = 3×N1/3 para amostragem de produtos químicos (Izenman, 2001).
Do the math using those approaches for several N and see how many different values for sample size you will get using those approaches. This can be very confusing and give you a false sense of security because you are complying with what others accept. I prefer to understand what I am doing instead of doing what others allow me to do it. What is your approach?
What not to do
- Poor study design
- Unplanned sampling
- Not considering historical data and system background. A good baseline should be generated with enough data and that should be verified versus time.
- Not representative sampling
- Testing prototypes not equivalent to products that will be commercialized
- Worst-case scenario not assessed
- Underestimate the defect probability of occurrence and assumptions not verified.
- All potential failure modes not assessed
- Sources of variability not assessed properly and in detail
- Remove analysis without technical justification
- KPIs not related to consumer risk and satisfaction
- Use of wrong assumptions
- Data removal with technical justification. Know how to deal with your outliners!
- Not clear understanding of what is being done – “this is as we always do”
Conclusion
The main message is that is not enough to run a validation protocol, execute it and report it. You will need to demonstrate that the state of control is maintained all the time. For that critical parameters should be measure at operations on regular basis under control charts or similar approaches. Parameters should operate within the control limits, and any variation from the expected behavior should be able to trigger an alarm at alert / action levels to assure right strategy is in place to correct the issues before reaching out of specification or causing quality deviations. Quality managers should work closely with operation managers and engineers to assure processes are in control.
References
ISO 9001:2015. Quality System Management.
https://www.6sigma.us/cause-variation/what-are-control-limits/
https://techqualitypedia.com/process-capability/
Billingsley, Patrick (1995). Probability and Measure (3rd ed.). John Wiley & Sons.
Galton F. (1889) Natural Inheritance
https://statisticsbyjim.com/hypothesis-testing/standard-error-mean/
https://www.harbor.com.br/harbor-blog/2017/07/06/capacidade-performance-significado/
Hewa Saranadasa. Pharmaceutical Technology MAY 2003. The Square Root of N Plus One Sampling Rule How Much Confidence Do We Have?
https://www.pharmaguideline.com/2014/04/Sampling-Plan-SQRT-n-plus-1-for-Pharmaceutical.html
A J Izenman. Statistical Science 2001, Vol. 16, No. 1, 35–57

Beatriz graduated in Biology in the Universidad Central de Venezuela (UCV), PhSc in Physiology and Biophysics by Instituto Venezolano de Investigaciones Científicas (IVIC) – Caracas, Venezuela; and Postdoc in Biophysics at Univ. of Califórnia (UCLA), Los Angeles (USA).
23+ years of work experience in Industry at Procter & Gamble, having global and regional responsibilities in the areas of Industrial Microbiology (R&D and manufacturing), Open Innovation, and quality assurance. Before P&G. worked also in academy and research during 13 years. Teaching experience (3 years) delivering courses for graduate and post-graduate students at UCV and IVIC.
Currently, delivering services as independent consultant in Quality Assurance, Industrial Microbiology, Open Innovation and Coaching at the BMRV Consulting (https://bmrvconsultoria.com/); active member of the Innovation Commitee of ABIHPEC (Brasilian Association of Industries of higiene, personal care, perfumery and cosmetics), and member of the Global Chamber, among others.


